With the new release of VAGRANT I thought it best to change the images on the
homepage to better reflect the capabilities. Click on any of the images to take
you to the example section that includes the code that generated the image and a
larger graph.
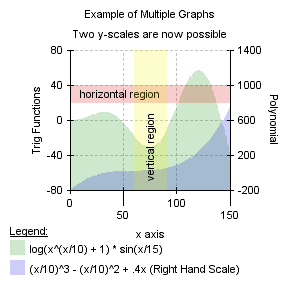
Note (08/23/2001): I have added support for highlighted regions in graphs. Check out filled line graph sample to see it in action.
| Filled Line Graphs: | Various Line Graphs: |
|

|
|
Pie Chart: |
|

|
|
|
News:
11/29/2001 VAGRANT 2.5 is in development and in CVS. Currently it only supports graphs (no charts) but the graph portion is fairly feature complete. One thing that is different is the inability to graph one set of data multiple times in the same graph (say if you wanted lines and dots). Scatter graphs should be coming soon and then I will get to work on charts. Hopefully I can make the pie charts a little more intelligent in terms of showing pie labels... Also, I'd like to give a word of thanks to people who have contributed to VAGRANT (all versions) with code, ideas and support: 6/15/2001 The source files that you can view make similar graphs but not necessarily the graphs being displayed. This is because the images are using the PNG module which at this time, is not accesible on this server (To my knowledge). 3/1/2001 I changed the class structure to have a generic graphing class that is responsible for the graphing logic and creation and image library specific files. The following images are updated images using the imlib2 (thanks to Rasterman and Mandrake and other imlib authors) php module written by Matt McClanahan, Steve Langasek available at http://mmcc.cx/php_imlib. The dynamic scripts linked on this page are not using the updated files yet but that should happen soon. Lastly, the chart stuff has not been changed at all but I hope to update that to the same style as the VAGRANT.class file. I wanted to integrate an imlib version of VAGRANT for the alpha blending. Graphs that overlap can be very difficult to view if they are solid colors so this seemed like a natural extension to a graphing class. As for the 3D pie charts, gratuitous but cool... |
Back to project page.
VAGRANT code has been released under the GPL